Creating a Meaningful Impact Report
Tactics to make your next report easier and more engaging

When an organization’s annual report lands in your inbox, are you eager to open it? If you’re responsible for producing one, do you embrace the task or put it off until you can’t procrastinate any longer?
At Mangrove, we’ve published an annual impact report since we became B Corp certified in 2016 and have helped many other organizations do the same. Over the years, we’ve discovered tools and tactics that make the process easier and result in a report that stakeholders are more likely to read. We’re sharing our insights here and hope they’ll make your next annual or impact report shine brighter with less effort.
Annual impact report process tips
Reframe the commitment
Focusing on the benefits an annual report delivers can make the task feel less heavy. Here are some of the positive outcomes we have experienced:
- Goal setting
Effective goal setting includes measuring outcomes. Our impact report allows us to reflect on what we have achieved over the year and where we have fallen short, giving us the opportunity to improve by making incremental adjustments. - Accountability
Part of the reason Mangrove became a Certified B Corp is that we are committed to having a positive impact on people, communities, and the planet. Our impact report keeps us accountable to those commitments by creating transparency to our clients and other stakeholders. - Celebration
Our impact report reminds us to pause and celebrate our progress and “big wins.” It also allows all our team members to look beyond their day-to-day activities to see the big picture. Many people on our team have said that they weren’t aware of everything we’ve accomplished as an organization before reviewing our report. It’s become an essential communication tool internally and externally.
Make it an ongoing effort
We’ve moved away from a once-a-year scramble to compile our impact report information by instead collecting and tracking data and milestones throughout the year. It’s much easier to track items as you go versus trying to remember a year’s worth of data when reporting time comes around.
To help us gather info as we move through the year, we copy and paste the format of the previous report into a simple Google Doc, which we use as a repository for notes and data.
Involve the team
We try to get our whole team to contribute to the report. This allows everyone to share in the celebration of what we’ve accomplished together and can uncover information that we might have overlooked.
Impact report content + design tips
Make your annual report as easy to understand as possible by paying equal attention to writing and design. How you present the information is an important part of communicating it well. Here are some guidelines we follow when helping clients with their reports.
Cohesive theme
Some organizations find choosing a theme that represents their year of impact helps frame the content while providing design direction. From a marketing standpoint, referencing the theme in the report’s title is more compelling than “Acme Company 2023 Impact Report.”
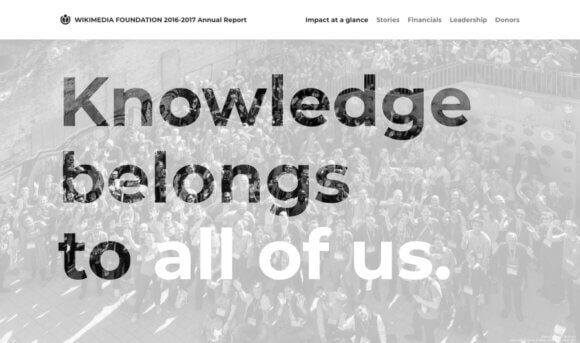
Captivating cover
Whether it’s the opening image of your report’s microsite or the print version’s cover, this is the first opportunity to grab attention. Use the theme or the organization’s brand to inform an eye-catching design. Designer tip: read the report before designing the cover.
Concise content
Tightly written content is critical in an annual report. Use plain language, short paragraphs, headers, and bullet points. Break content into logical units to help the designer create scannable content sections to guide the reader.
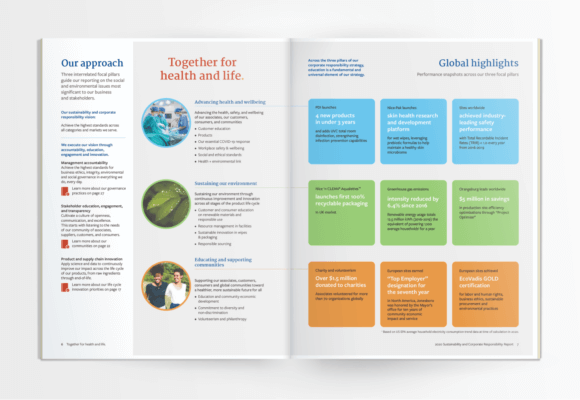
Consistent style
To aid the reader, make sure your style choices are consistent and uniform throughout the report. Check font styles, font sizes, and the overall layout. Hold the overall layout together with a strong grid and column structure. If you are creating multiple formats for the report, each will require different design specifications and parameters for layout.
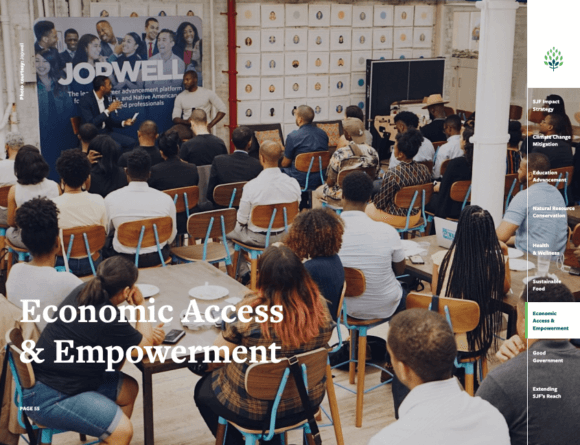
Expressive photos
High-quality photos can make a dramatic difference in the visual appeal of an impact report. Professional custom photography that showcases the organization’s activities is best. But high-quality stock images or illustrations can work well too.
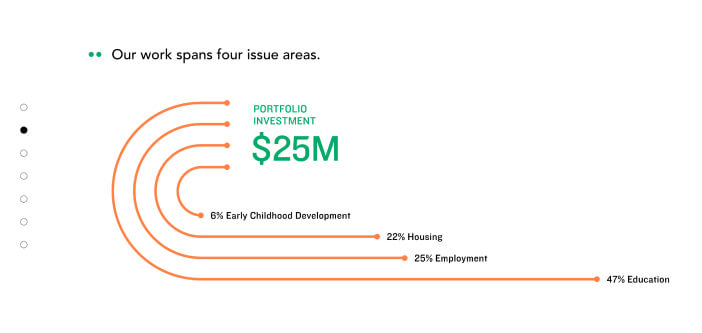
Creative content elements
Keep readers engaged by communicating the report’s information in various formats. Consider pie charts, pull quotes, timelines, and animations that will draw the eye.
A summary of the report translated into an infographic can convey the most critical information for those who might not have time to read the whole report. It’s also perfect for sharing on social media channels.
Accessible to all
Ensure that as many people as possible can read the report by choosing an accessible color palette. Include written descriptions of infographics or charts, and take care with animations by providing a way to stop them with keyboard or voice-activated accessibility shortcuts.
Formatting, tools and platforms
Give readers options
Depending on your organization, you might consider publishing your annual or impact report in various formats. Web-based formats (such as this report for our client Tipping Point) have become standard, but some sectors include audiences that prefer (or need) a print version or a downloadable PDF. Note that various formats have different accessibility challenges. As one example, PDFs can be inaccessible unless special attention is paid from the beginning of the design process.
Development tools and platforms
If your annual report is straightforward and doesn’t require unique customization or functionality, Webflow or Squarespace can serve as an excellent option. This “no code” content publishing platform allows for efficiencies in creating microsites when the content is unlikely to change after publication (such as annual reports). Webflow and Squarespace allows us to create simple yet attractive sites for clients more quickly than when using more robust CMS platforms such as WordPress.
For startups or organizations with straightforward requirements and limited budgets, our friends at Unit of Impact built a tool to help small businesses collect and organize impact data and turn it into a report format. It’s a terrific option for a robust report that doesn’t require more complex custom design elements or a downloadable or printed version.
Consider search engine optimization (SEO)
Unlike a stand-alone PDF document, a landing page or microsite for your annual report allows it to surface through online search. If you offer a PDF, make it downloadable from a landing page.
Including clear and trackable click actions on your annual report’s landing page will allow you to understand how visitors interact with it. Anchor links to other content, share buttons, or ways to sign up to receive a newsletter or updates offer ways to engage and measure that engagement.
Look forward to your next impact report
We’ve improved our impact reporting process over the years and see it as a celebration of the year’s accomplishments that we share with our whole team. Making it a group effort that spans the year and employing tried and true design principles can make your next report easier to create and more engaging.
Need some inspiration? Here are a few examples of the reports we’ve had the honor of designing for clients. If you need a hand with yours, see how we can help.
Some Impact and Annual Reports by Mangrove (and the Manoverboard team)
A Certified B Corp, Mangrove is a woman-owned website design and development company with a diverse, talented team distributed around the globe. We’ve been building websites since 2009 that amplify the work of change-making organizations and increase the competitive power of businesses owned by historically underrepresented people.
If you found this post helpful, subscribe to our monthly newsletter for notice of future posts and other news from us.